
See every network's real numbers, side by side
Growth, reach and engagement from every connected account, compared side by side across Instagram, Facebook, YouTube, TikTok, X and LinkedIn. Real data only, never invented, packaged into white-label reports your clients can trust.
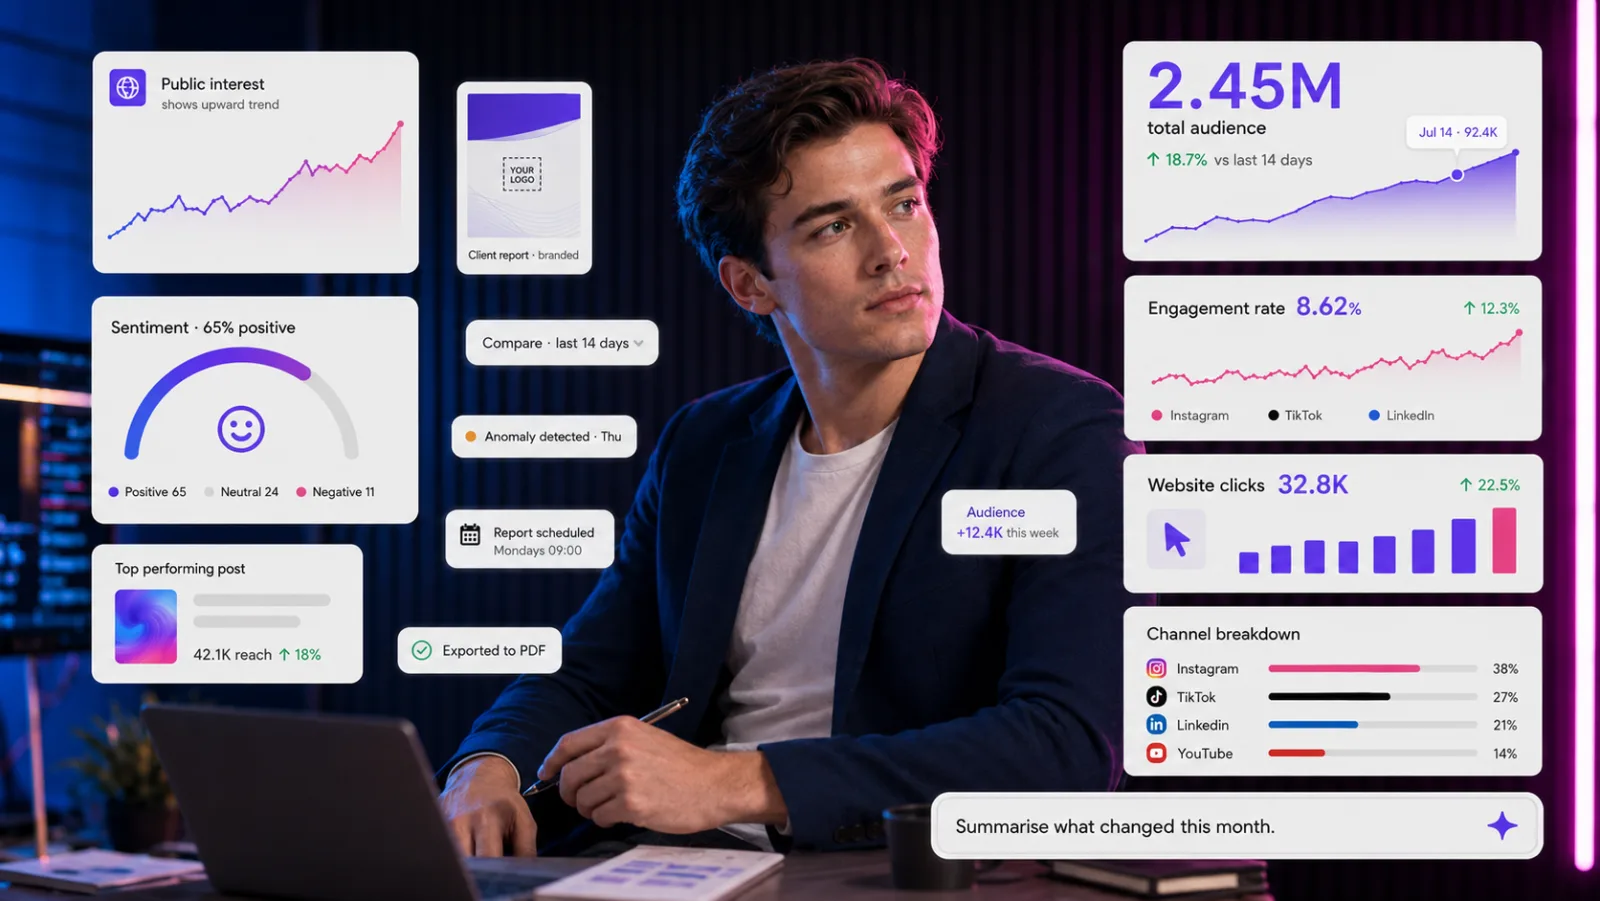
Every network, side by side
Growth, reach and engagement from all six networks sit in a single grid, pulled live from the accounts you actually connect. No more stitching six separate analytics tabs into one story, and no estimated or sampled figures.
- Growth, reach and engagement in one grid
- Instagram, Facebook, YouTube, TikTok, X and LinkedIn together
- Drawn live from real connected accounts
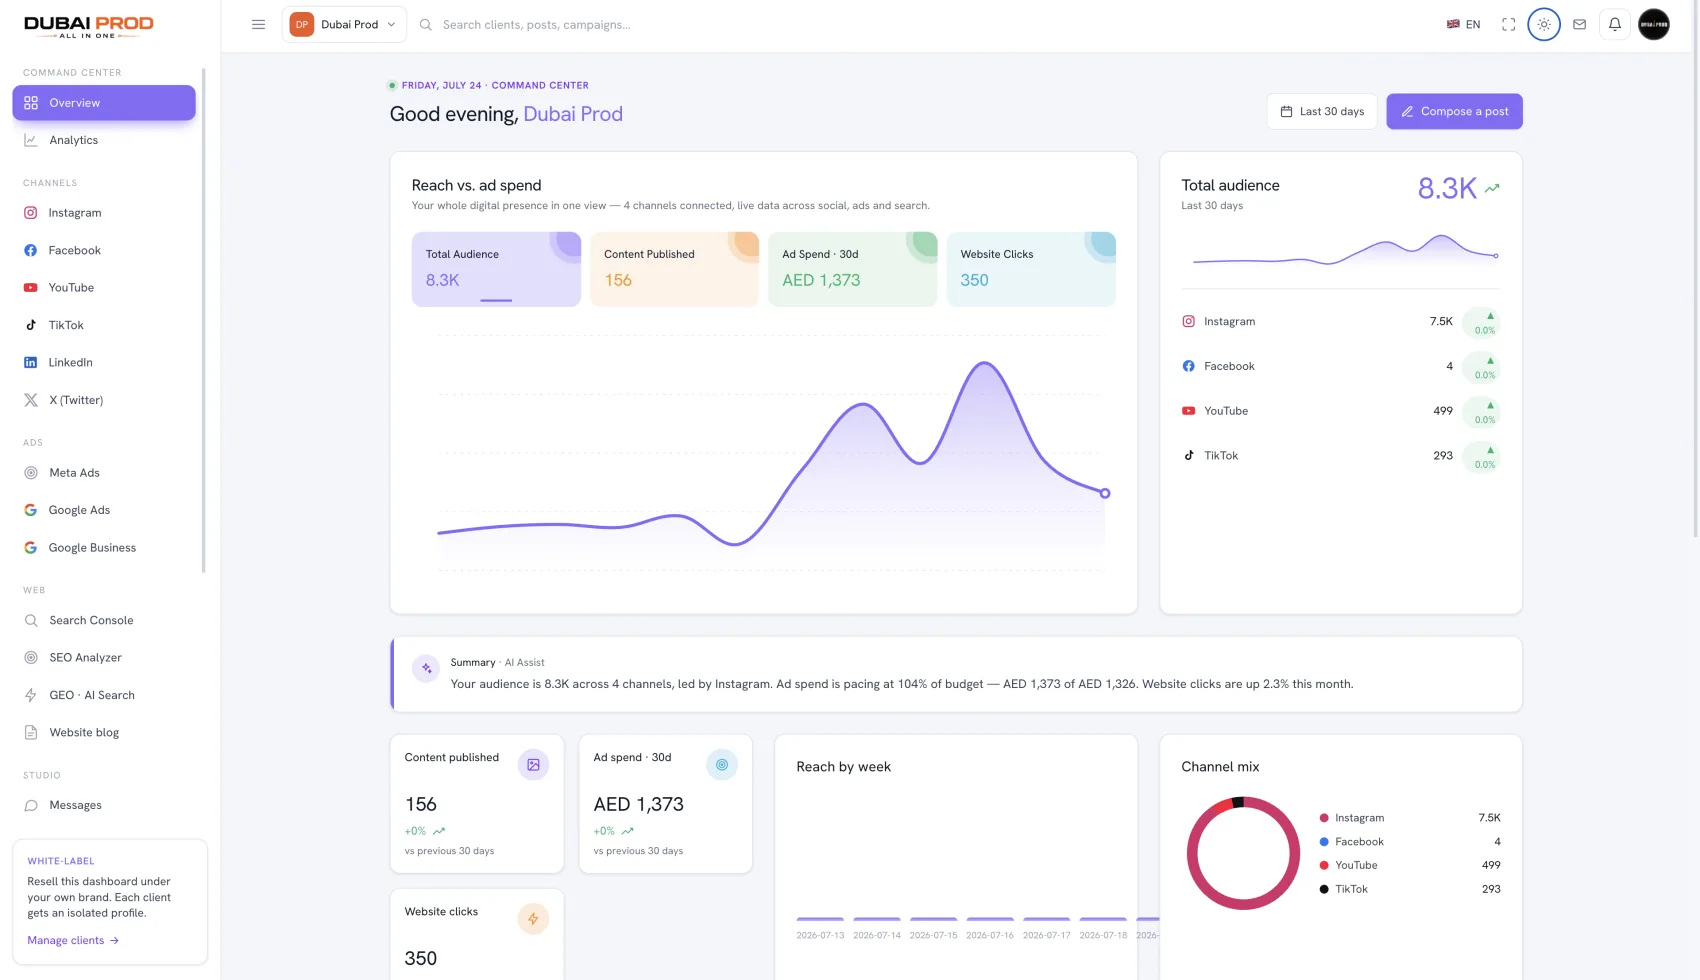
See what actually performs
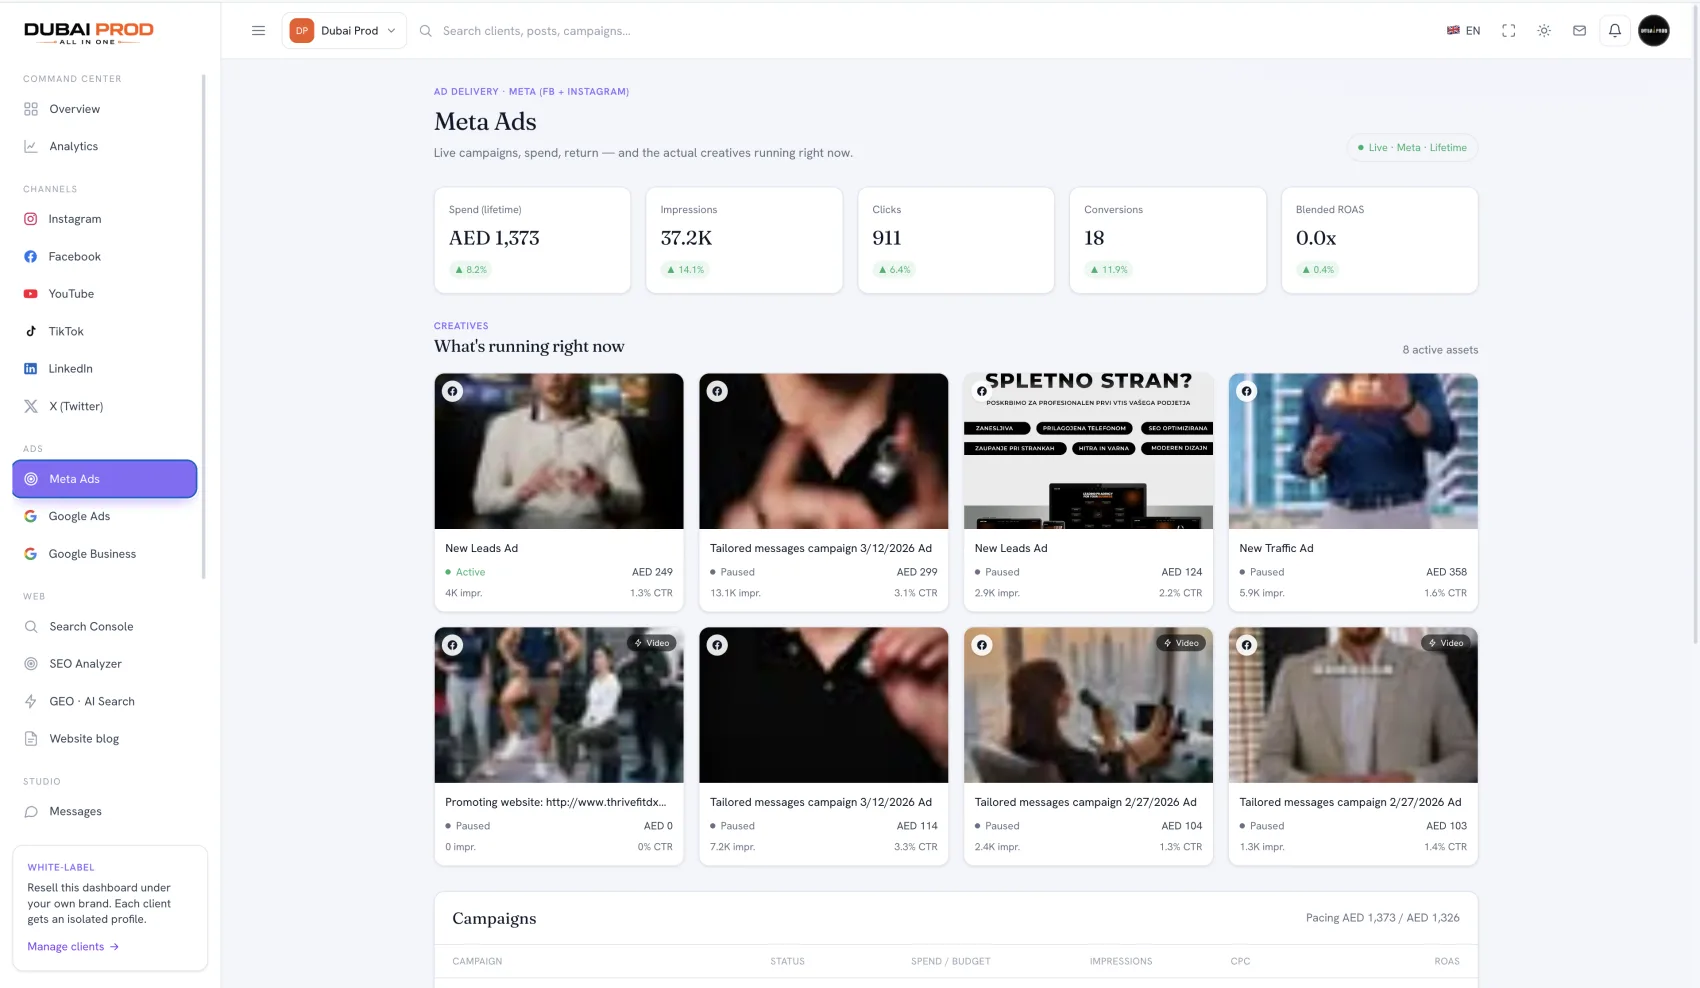
The dashboard surfaces your best-performing formats on each network, so you know what to make more of. And because Meta and Google Ads delivery sits in the same platform, ROAS appears right beside your organic reach.
- Best-performing formats surfaced per network
- Paid ROAS shown beside organic reach
- Spot the posts and channels driving results
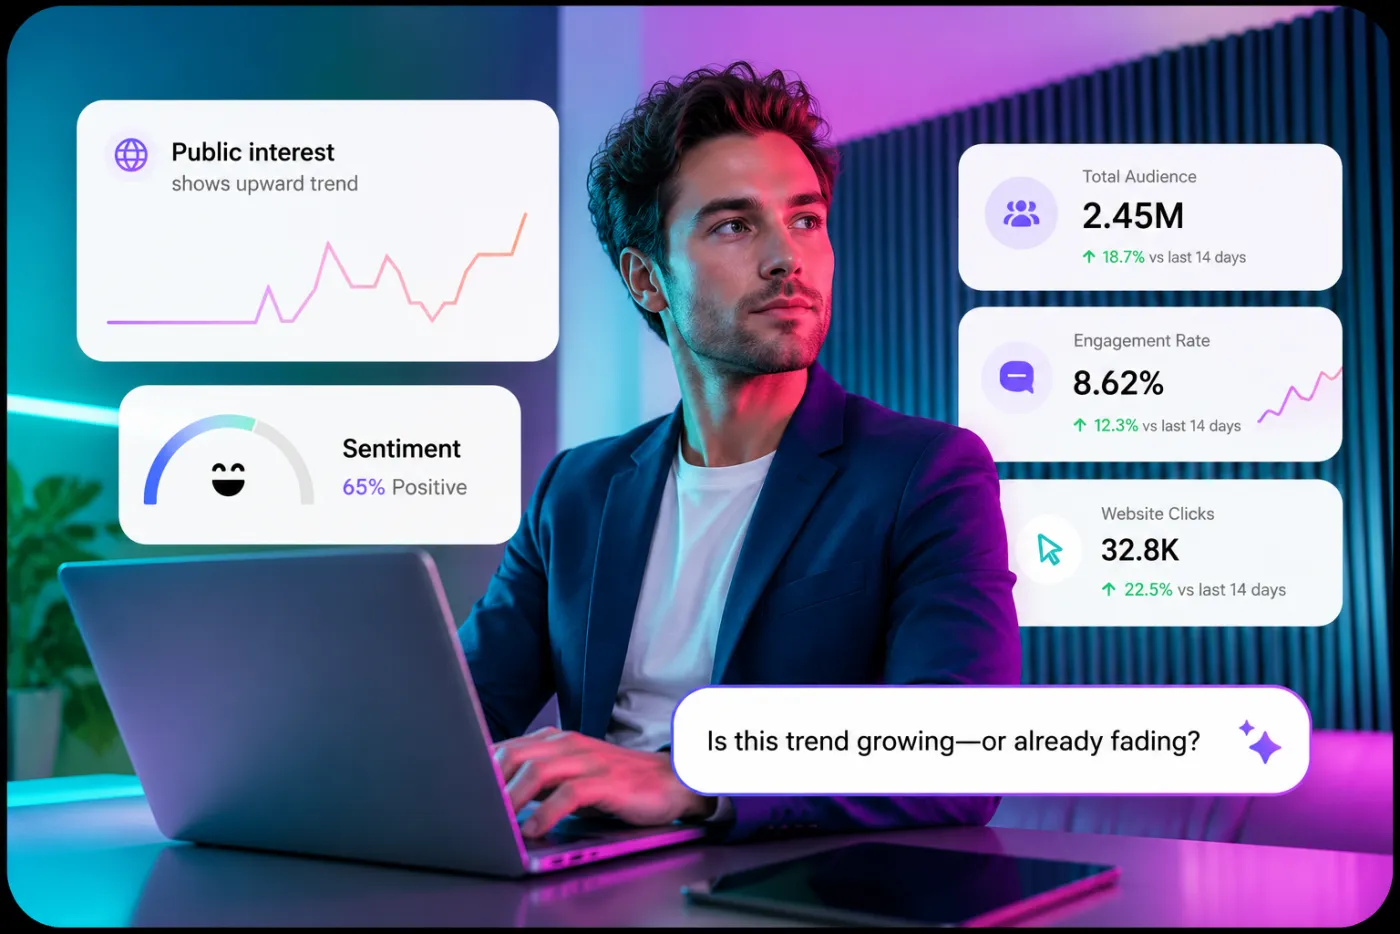
White-label client reports
Turn the same data into polished reports presented entirely under your own brand. Track team-productivity reporting across the workspace, while per-client isolated workspaces keep every account's numbers cleanly separated.
- Reports delivered under your own brand
- Team-productivity reporting built in
- Per-client isolated workspaces keep data separate
Built to make analytics & reporting effortless
Every figure comes from accounts you connect directly, so nothing is ever estimated, sampled or invented.
See all six networks in a single view instead of switching between six separate analytics tabs.
Know which formats win on each network so you can double down with confidence, not guesswork.
Hand clients clean, white-labelled reports that make the renewal conversation an easy yes.
Questions, answered
Where does the analytics data come from?
Everything is pulled from the social accounts you connect directly to the platform. We never estimate, sample or invent numbers, so if a figure appears in a report, it came from a real connected account.
Which networks can I compare in one place?
Instagram, Facebook, YouTube, TikTok, X and LinkedIn are shown side by side in a single dashboard. Growth, reach and engagement line up across every network without switching between tools.
Can I brand the reports for my clients?
Yes. Reports are fully white-label, so agencies can present them under their own brand. Per-client isolated workspaces keep each account's data separate, and roles, 2FA and an audit log keep access controlled.
Reporting your clients can actually trust
Connect your accounts and see growth, reach and engagement across every network in one white-label dashboard, built on real data only.